.png)
Evaluating Statistical Power in Metrics
Statistical power in A/B testing metrics is crucial for detecting true effects and avoiding Type II errors. It is influenced by factors such as sample size, effect size, significance level, and base conversion rate. The power of a metric can be calculated using the formula:
**Power=1−β=P(reject H0∣H1 is true)**
β is the probability of a Type II error. A power of 80% is typically considered adequate.
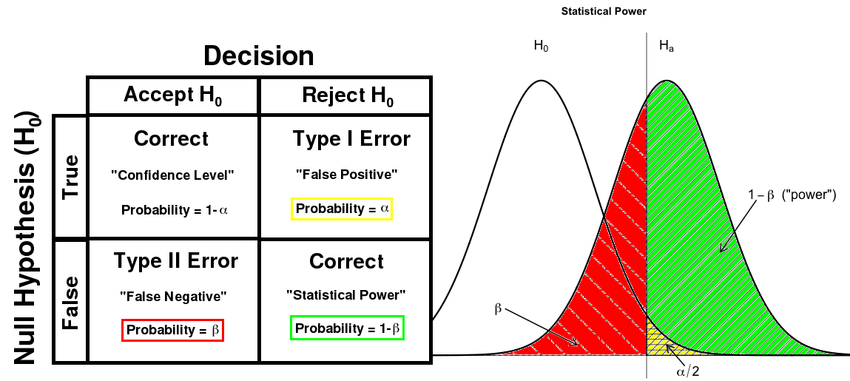 Image Source:Research Gate
To evaluate and improve the statistical power of metrics:
- Conduct a power analysis to determine the required sample size for detecting a minimum detectable effect (MDE).
- Consider using cumulative metrics for earlier detection of strong initial signals, but be aware that they may lead to time-dependent estimands.
- Balance the trade-off between statistical power and practical significance, as highly powered tests may detect very small effects with little real-world impact.
- Utilize tools like G*Power or sample size calculators to optimize experimental design.
North Star Metrics for Growth
North Star Metrics (NSMs) are pivotal for driving sustainable growth in product-led companies. These metrics encapsulate the core value delivered to customers and serve as leading indicators of revenue. For growth teams, an effective NSM aligns efforts across departments and focuses on customer-centric outcomes. Key characteristics of a strong NSM include:
- Reflects customer value and engagement (e.g., Spotify’s “Time spent listening”)
- Predictive of long-term success and revenue generation
- Actionable by product and marketing teams
- Balances acquisition and retention (e.g., “Trial accounts with >3 users active in week 1” for SaaS)
Growth marketers should leverage NSMs to prioritize experiments, guide product development, and optimize user experiences. By continuously tracking and iterating on these metrics, teams can drive compounding growth effects and improve key business outcomes such as customer lifetime value (CLV) and retention rates.
Statistical Framework
The research establishes three distinct categories of experimental outcomes:
- Known Outcomes (A > B)
- Clear preference for variant A over B
- Statistically significant improvements in North Star metrics
- Validated through replication
- Unknown Outcomes (A ? B)
- Inconclusive results
- Statistically insignificant changes in North Star metrics
- A/A Outcomes (A ≃ B)
- Control experiments where variants are identical
- Used to validate the null hypothesis
Key Performance Measurements
𝑧-scores, measuring how many standard deviations the null hypothesis effect size of 0 is below the empirical mean:
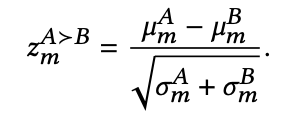
The subscript 𝑚 denotes the metric, superscripts denote variants, 𝜇 is the sample mean and 𝜎 the variance of the sample mean.
 Image source:Unbiased Research
The framework measures three critical error types:
- Type-I Errors (False Positives)
- Measured through A/A experiments
- Uses standard Gaussian quantile function for hypothesis testing
- Type-II Errors (False Negatives)
- Evaluated through A/B experiments
- Particularly important for significant system changes
- Type-III Errors (Sign Errors)
- Assessed through known outcomes
- Measures directional mistakes in conclusions
Practical Implementation
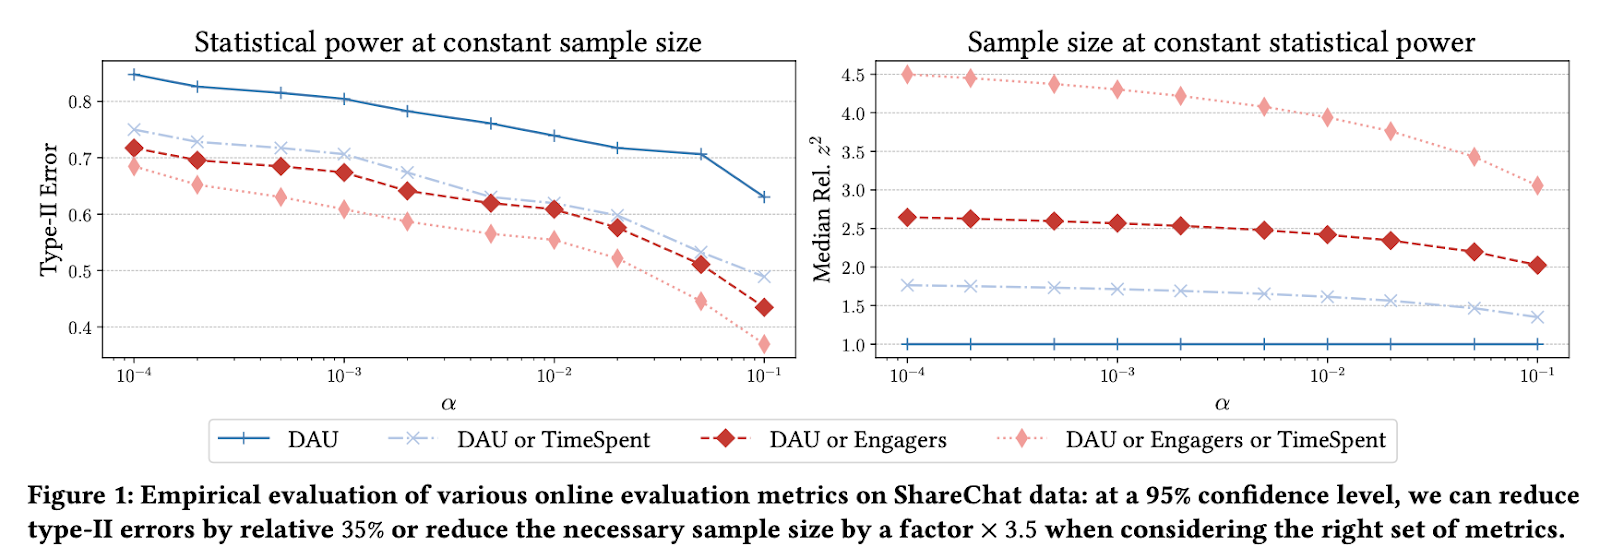 Image Source: Research Paper”Powerful A/B-Testing Metrics and Where to Find Them”
Research at ShareChat demonstrated significant improvements using multiple metrics:
- Combined metrics reduced type-II errors by 35%
- Decreased required sample size by a factor of 3.5
- Utilized metrics like Daily Active Users (DAU), Engagers, and TimeSpent
Key Takeaways: Revolutionize Your A/B Testing Strategy
The insights from ShareChat’s research underscore the critical role of A/B testing metrics in the success of digital platforms. As we move forward in an increasingly data-driven world, the ability to choose and interpret the right metrics will be a key differentiator for businesses.
The power of A/B testing lies not just in the practice itself, but in the careful selection and analysis of metrics that truly matter. By focusing on metrics that provide deep insights into user behavior, satisfaction, and long-term value, companies can create more engaging, personalized, and successful digital experiences.
As platforms continue to evolve, so too will the metrics used to evaluate them. The companies that stay ahead of this curve, constantly refining their approach to A/B testing and metrics analysis, will be the ones that thrive in the competitive digital landscape.
In essence, the right A/B testing metrics are not just tools for measurement – they are the compass that guides digital platforms towards innovation, user satisfaction, and sustainable growth. As ShareChat has demonstrated, finding and utilizing these powerful metrics is an ongoing journey, one that promises to shape the future of digital experiences for years to come.
See Shaped in action
Talk to an engineer about your specific use case — search, recommendations, or feed ranking.